
Pico as a simple characteristic curve recorder on a RB-P-XPLR from Joy-it
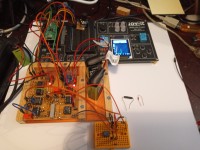
The Joy-it Explorer Set Raspberry Pi Pico RB-P-XPLR has a color display with a resolution of 160x128 pixels in addition to buttons and other components. With the circuits I developed on a small circuit board, a simple characteristic curve recorder for diodes and transistors can be realized very well for the hobby sector. The special feature of this version is that after the initial adjustments no external voltmeter is required during operation.
Prehistory:
I have already presented a project Raspberry Pi Pico as a simple characteristic curve recorder on these pages. In this case, a digital multimeter is also required for the characteristic curve recording of transistors and field effect transistors. After experimenting with it for a certain time, I thought about whether it would not be possible to do without a digital multimeter and have the measured values displayed on a display. This works excellently with the display on the Explorer Board RB-P-XPLR from Joy-it, I found out.The display has a resolution of 160x128 pixels. So there is enough space on top of it to display several values when recording characteristic curves.
The analog inputs of the Pico ADC0, ADC1 and ADC2 are busy recording characteristic curves. For this reason, I have chosen the following new way for the generation of an adjustable external DC voltage for the measurements on transistors and field-effect transistors:
The Pico is connected to an ATtiny13A via its UART0 pins and intermediate optocouplers. The small microcontroller contains a program that was developed for him with the free BASCOM AVR Demo Version from MCS-Electronics. Because the ATtiny13A does not have a hardware UART, a Software UART is defined in BASCOM AVR for 9600 baud. PB2 serves as input (RX) and PB1 as output (TX). The Raspberry Pi Pico reads the voltage at ADC0 on the potentiometer on the breadboard of the Explorer Board and converts the determined value into a byte. Then it sends it together with a command byte to the ATtiny13A. This generates a PWM signal at PB0.The PWM signal is smoothed and amplified to over 7 volts in the first operational amplifier in IC4 and offered to the second, which serves as a voltage follower. At its output, a DC voltage is available that can be adjusted with the help of the potentiometer mentioned above.
The ATTiny13a receives two more instruction bytes from the Pico via its UART0, which ask it to measure the voltage at its analog inputs ADC2 and ADC3 and send the generated 10 bit values to the Pico. This calculates the two current voltage values and shows them and also the differential voltage of these on the display above. Since the ATTiny13A is supplied with 5 V voltage by IC8, both analog inputs have a voltage divider because of the maximum possible voltage U_out2 more than 7 volts.
In the characteristic curve recording for the example of an NPN transistor, when controlled via the base current, according to the circuit diagram of the project U_out2 is connected to the base via a resistor of 100 kiloohms, for example. Analog input ADC2 of the ATtiny13A is also connected to U_out2 via a voltage divider and its ADC3 is connected to the base of the Transistor via a voltage divider. The Raspberry Pi Pico receives the corresponding values of the two voltages, calculates the difference between them and shows the three values at the top of the display.
With the help of Ohm's law, the current into the base can be easily calculated from the voltage difference and the resistance value.
The Explorer Board RB-P-XPLR from Joy-it is also offered for sale by Elektor.
Another special feature of this project: Pico programs ATTiny13A
If you own an ATTiny13A,You can program it with the Pico and a simple circuit with three NPN transistors on a breadboard.
the representation on the circuit diagram Pico_prog_ATtiny13A.png shows you how to connect the components.
Then connect the Transistors to the pins of the Pico mentioned there and the Pins of the ATTiny13A to the outputs of the Transistors. Now You load the program pico_prg16wd.py in Thonny and start it. If you have previously loaded the file Pico_T13_pwm.hex into the program memory of the Pico, enter this name below. The Pico then transfers the bytes from it to the ATTiny13A.
You can then insert it into the IC socket intended for it on the 70x80mm PCB with solder dots, so that it works there, as I explained above.
Suggestions for the construction of the circuits on the 70x80mm PCB with solder points:
First, after the image files, which were created with the Lochmaster4.0 software from abacom and can serve as an assembly aid together with the circuit diagram, place the precision contacts on the 70x80mm PCB with solder points. With a digital multimeter in the resistance measurement area, in which a buzzer is usually switched on in the lowest measuring range, you can check whether you have made any mistakes during soldering, for example whether short circuits have accidentally occurred with soldering. These must be remedied immediately. There may only be a connection between certain contacts of the IC sockets if this is provided for in the schematic.
All pins that are connected according to the circuit documents are connected to GND must be connected correctly and all pins of IC1, IC2 and IC3 must also be in contact with each other, otherwise the ICs will not function properly later. Then solder all the connecting cables between the individual components and then the three trim potentiometers, the resistors, some of which have to be mounted upright, the light-emitting diodes, the voltage regulator, the condensers, some of which have to be soldered on the conductor track side under the IC sockets for the operational amplifiers.
If you have built the circuits on the 70x80mm circuit board all according to the circuit documents and the images generated with the help of the Lochmaster4.0 software from abacom and have thoroughly checked them for errors and corrected any errors that may have occurred, you can Without ICs, check whether the power supplies can be switched on with two 9V batteries or 9V batteries in series using the jumper provided for this purpose. The small red LED2 light-emitting diode should now light up. If you use a digital multimeter to measure the voltage between pins 8 of the IC1, IC2 and IC3 and GND, it should be 18 V.
If you turn on Bat1 with 9V using a jumper, LED1 should be lit, and there should be 5V between the output of the voltage regulator IC8 and GND_extern. If you have soldered in all components correctly beforehand, and all errors that had arisen have been fixed, there must be no connection between GND and GND_extern! Now You remove the jumpers again to switch off the voltage sources again and plug the ICs IC1, IC2 and IC3 as well as the module with a MCP4725 into the IC sockets provided for this purpose. Then connect the circuits on the 70x80mm PCB with solder points according to the specifications in the schematic using flexible insulated wires with the pins provided for this purpose of the Raspberry Pi Pico on the Joy-it Explorer Board.
Please note the following: The circuit points ADC1(GP27) and ADC2(GP28) are not connected to the respective pins of the Pico at first, so as not to overload the two analog inputs by possibly too high voltages! Then use the small switches on the Explorer Board to turn off the buzzer (GP27, analog input ADC1), the relay (GP28, analog input ADC2), the LEDs (GP1, UART0 RX), the DHT11(GP0, UART0 TX). Otherwise errors will occur when you start the MicroPython program I developped. However, the display (TFT) and the buttons (BUTTONS) remain switched on. You need the libraries in MicroPython for the program I developed for a Raspberry Pi Pico on the Explorer Board RB-P-XPLR from Joy-it.
These can be found on the Internet pages https://joy-it.net/en/products/RB-P-XPLR Download it there and unzip it in a previously created folder. It is best to also transfere the three MicroPython programs I developed and the two HEX files for an ATtiny13A there. You start the Thonny development environment after preparing the Raspberry Pi Pico on the Explorer Board with the file with the uf2 extension.
Files required for the project in the program memory of the Raspberry Pi Pico:
Before using one of the three MicroPython programs developed by me, you need the files ST7735,py, lcd_gfx.py and font5x7.fnt and also the files T13_1v3a.hex and Pico_T13_pwm.hex in the programm memory of the Pico.
To do this, click on Thonny View in the menu at the top and click on Files.You will now see a narrow area to the left of the area where the program text is displayed. At the bottom of this are the files that are already available in the program memory of the Pico. Initially, none of the above files will appear there. At the top, you should see the folder into which you had previously loaded and unzipped the above-mentioned files in addition to the programs I developed in MicroPython. Right-click on the three files ST7735.py, lcd_gfx.py, font5x7.fnt, T13_1v3a.hex and Pico_T13_pwm.hex and load them into the Pico's program memory.
Now, if you start the program KLn_joy_test.py in Thonny, the display on the Explorer Board shows the start image at the top with the designations characteristic curve recorder and below it TEST PROGRAM and below it a grid with labels on the left and bottom edges. If you switch on the voltage of 18V with the help of the jumper on the top right of the board with the ICs IC1, IC2, IC3 plugged in and the module with a MCP4725, the red light-emitting diode lights up. Now connect a digital multimeter between the switching point U_out1 and GND and start the test program. If you then press the button at the top (GP10) on the Explorer Board, this voltage should rise from 0V to a certain amount in a few seconds. With a small screwdriver on the trim potentiometer R16 you can now set your value to about 10V. If you connect U_out1 to X14 on it with a flexible insulated line, you should be able to measure 2.5 V between the ADC2 connector to IC2 and GND.
Please note the following: There must be no connection between the two analog inputs ADC1 and ADC2 and the circuit points with the same designation on the 70x80mm PCB!
Now connect U_out1 to X13, then you will measure a voltage of 5 V between the circuit point ADC2 on the board mentioned above and GND. Then connect an ordinary red LED via two resistors of 1 kiloohm connected in parallel between U_out1 and GND*. You then use a digital multimeter to measure the voltage of a few millivolts between GND* and GND.
This should have a value of 17 (or 18) millivolts. Now connect the digital multimeter between the point ADC1 on the IC3. Then use a small screwdriver on the trim potentiometer R13 to change the gain of the first op-amp in IC3 until the multimeter shows 1.7 V (or 1.8 V). If you then connect the anode of the light-emitting diode to the point X14 of the voltage divider in front of the input of the first op-amp in IC2 using a flexible insulated wire, you should be able to measure about a quarter of the voltage between the anode of the LED and GND between the ADC2 terminal of this IC and GND.
The special feature of the circuits of this project, in which the Raspberry Pi Pico functions as a simple characteristic curve recorder, is that according to the settings described above, it is no longer necessary to use a digital multimeter as an external voltage meter for the characteristic curve recording of Transistors and filed-effect transistors, because the measurements of the voltage of the field-effect transistor between the gate and the source or the voltages at the series resistor in front of the base of an NPN or PNP transistor can be used to indirectly determine the voltage of the the basic current is carried out by an ATTiny13A from Microchip (ATMEL) when the program is run in MicroPython and can be displayed at the top of the display of the Explorer Board and easily calculated with the help of Ohm's law with Ohm's law as I explained above.
In the case of a connected N-channel JFET, such as a J112, the pin D(Drain) is connected to U_out1 and the pin S(Source) to GND* for its characteristic curve recording. The Gate is connected to GND_extern(GND_e) and U_out2 to GND of the rest of the circuits. For example, with this component, pin ADC2(PB3) together with pin ADC3(PB3) of the ATTiny13A can be connected directly to U_out2. On the display above, the value shown for U2-U3 is almost 0 V and does not need to be taken into account.
When recording characteristic curves of diodes and light-emitting diodes, the U2, U3 and U2-U3 display on the screen should not be taken into account.
After setting the voltage U_out1 to 10 V with the trim potentiometer R15 with the test program, as explained above, and also setting the output voltage ADC1 on IC3 with the light-emitting diode connected, the test program can be ended. Now the two analog inputs ADC1(GP27) and ADC2(GP28) can be connected with flexible insulated cables to the circuit points with the same designation on the 70x80mm PCB with solder points. The 9V battery and the other two, which provide a voltage of 18V when connected in series, are then switched on with the jumpers and the program in MicroPython can be loaded and started in Thonny.
Please note the following: The 9V battery must always be switched on, even when recording the characteristic curve of diodes, otherwise the program will display an error message and consequently not work properly.
The reason for this is that in an infinite loop (while True:) the analog input ADC0 of the Pico, which is connected to the potentiometer on the breadboard of the Explorer Set from Joy-it, reads the value that has just been set and wants to contact the ATTiny13A, but this is in this case not possible, because this microcontroller is not supplied with 5V via the voltage regulator 78L05 and therefore does not work.
Additional explanations of the programming of the ATTiny13A by the Pico in this project:
For the ATtiny13A required in this project, I have added the file in BASCOM AVR and the file created with it in HEX format. With the MicroPython file pico_prg16wd.py, you can have it transferred by the Pico into an ATtiny13A using the small circuit with three npn transistors, that I mentioned above. The components can be placed on a small breadboard. At first, you remove the module with the MCP4725. In addition to the Pin_GND and Pin_3V3 of the Pico, the pins GP8(MOSI),GP9(SCK) are available at its slot. You connect these points with insulated flexible wires to the small circuit in the picture mentioned above and insert an ATtiny13A on the breadboard at the designated location. You will also need a line to Pico_GP0(RES).
The template for this was a Python program for a Raspberry Pi, which I had already developed in 2017.
I was able to adapt it accordingly for the Pico.
First, you transfer the two HEX files T13_1v3a.hex and Pico_T13_pwm.hex to the Pico's program memory, if If you haven't done it before, as mentioned above.Then load the program pico_prg16wd.py in Thonny and start it. Enter the full name of the HEX file below, and now the file T13_1v3a.hex for testing. The program starts and transfers the bytes from the HEX file to the program memory of the ATTiny13A. During the transmission, the LED flickers, which is connected via a resistor between PB1 of the ATTiny13A and GND. After that, it flashes at a certain clock frequency. If this test was successful, start the program again and now transfer the file Pico_T13_pwm.hex to the microcontroller.
You can then insert the ATtiny13A programmed in this way into the 8-pin IC socket at the designated location on the 70x80mm board with solder points. You can remove all the connecting wires to the circuits on the breadboard and reconnect the cable from Pico_GP0 to the designated place on the 70x80mm board with solder dots. Now reinsert the module with the MCP4725 in the designated place. Now you can switch the 9V battery and the two 9V batteries to be connected in series to supply power to the circuits on the 70x80mm PCB with solder points again with the jumpers.
If you then load and start the MicroPython program for characteristic curve display in Thonny.
You can connect diodes, light-emitting diodes or transistors according to the information in the circuit diagram and record their characteristic curves and have them displayed in one of the four possible colors. The program generates CSV files to match the four possible colored characteristic curves.
These are transferred to the program memory of the Pico and can later be processed in LibreOffice Calc, for example.
Summary and outlook:
The project,I presented above, was developed by me. It fits very well to the Explorer Board RB-P-XPLR from Joy-it with the colored display with a resolution of 160x128 pixels on it .
As a special feature, the characteristic curve is displayed after an initial adjustment without an external voltmeter.
As a further special feature, the ATTiny13A, which is necessary for the project, can be programmed in MicroPython with a simple circuit on a small breadboard and the program I developed for the Rapsberry Pi Pico.
The circuits for it as well as the two programs in MicroPython are designed for the joy of experimenting with the Explorer Board RB-P-XPLR from Joy-it and programming the Pico in MicroPython.
They are not perfect and can certainly be improved. The accuracy of the characteristic curve representations with the simple circuits presented should be sufficient for the hobby sector.
An extension of the circuits to include a power opamp that provides a characteristic curve recording of transistors with a higher current is possible.
Mises à jour de l'auteur